Five Tips to Improve Your ArcGIS Dashboards
September 21, 2023 2023-09-21 8:03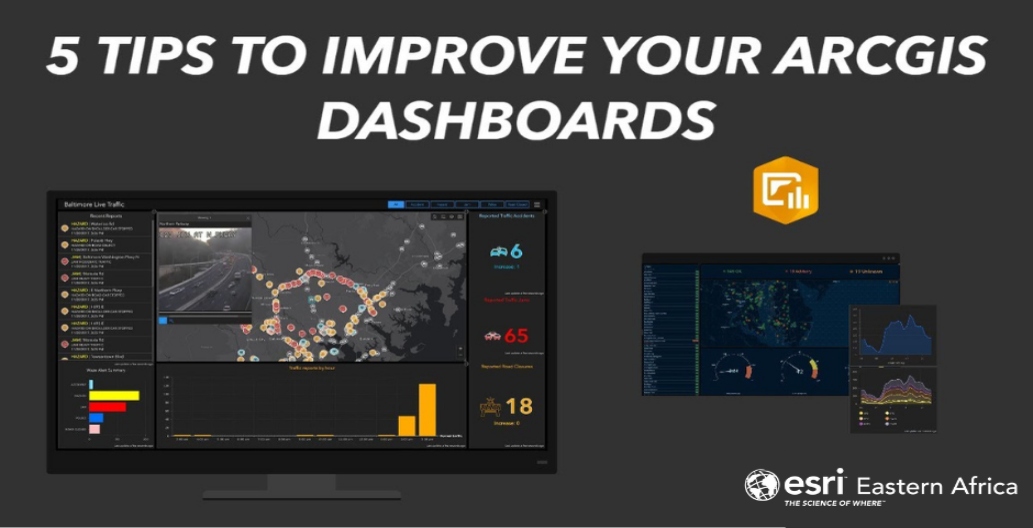
Five Tips to Improve Your ArcGIS Dashboards
ArcGIS Dashboards is a powerful tool that allows users to create interactive and visually appealing data visualizations. Whether you’re presenting information to stakeholders, monitoring real-time data, or analyzing spatial patterns, optimizing your ArcGIS Dashboards can significantly enhance the impact and usability of your visualizations. In this article, we’ll explore five tips to improve your ArcGIS Dashboards and take your data presentations to the next level.
Tips to improve your ArcGIS Dashboards
Here are 5 tips to improve your ArcGIS Dashboards:
Define clear objectives and target audience
Before diving into the design and configuration of your ArcGIS Dashboard, it’s crucial to define clear objectives and identify your target audience. Determine the key messages you want to convey and the specific insights you want your audience to gain from the dashboard. This understanding will guide your design choices and ensure that your dashboard effectively communicates the desired information to the intended recipients.
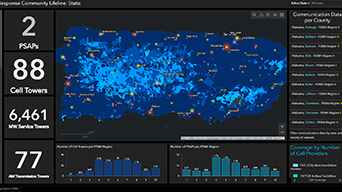
Streamline your layout
A well-organized and visually appealing layout is essential for an effective dashboard. Consider the following tips to streamline your layout:
a. Use a grid-based system: Aligning elements to a grid creates a consistent and structured layout.
b. Keep it simple: Avoid cluttering the dashboard with unnecessary elements. Focus on presenting the most critical information.
c. Utilize white space: Give elements room to breathe by incorporating ample white space, which helps improve readability and overall aesthetics.

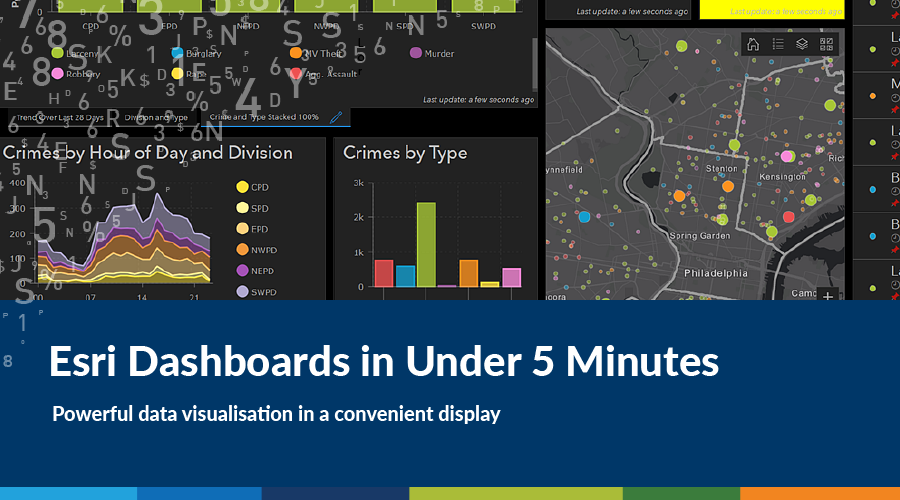
Choose Appropriate Visualizations
Selecting the right visualizations is crucial for effectively conveying information. Consider the following factors when choosing visualizations for your ArcGIS Dashboard:
a. Data types: Different data types require specific visualizations. For example, use bar charts or pie charts for categorical data and line charts for temporal trends.
b. Audience comprehension: Consider your audience’s familiarity with different visualization types. Opt for visualizations that are easily interpretable by your intended audience.
c. Interactivity: Leverage the interactivity features of ArcGIS Dashboards, such as filtering and drill-down options, to allow users to explore the data in a more dynamic and engaging way.
Incorporate strategic interactivity
ArcGIS Dashboards offer various interactive features that can significantly enhance user engagement and data exploration. Here are some tips to incorporate strategic interactivity:
a. Utilize filters: Add interactive filters to enable users to interactively explore subsets of the data based on specific criteria or variables.
b. Drill-down capabilities: Allow users to drill down into specific areas or data points to reveal more detailed information.
c. Use actions and URL parameters: Link different components within your dashboard or external webpages to create seamless navigation and provide additional context.
Regularly review and update
Lastly, it’s essential to regularly review and update your ArcGIS Dashboards to ensure they remain relevant and effective. Consider the following practices:
a. Collect feedback: Seek feedback from your audience and stakeholders to understand their needs and identify areas for improvement.
b. Monitor data sources: Continuously monitor the data sources feeding your dashboards. Ensure that data is accurate, up-to-date, and reflects the most recent insights.
c. Iterative improvement: Implement a cycle of iteration and improvement based on feedback, changing requirements, and emerging trends. Regularly evaluate your dashboards’ performance and refine them accordingly.
With these best practices in mind, you’ll be well on your way to presenting data in a more engaging and informative manner, empowering your audience to make better-informed decisions.
Click here to buy ArcGIS Products.