Visualizing Real-Time Data for Effective Decision Making
March 4, 2024 2024-03-04 9:12Visualizing Real-Time Data for Effective Decision Making
In today’s data-driven world, making informed decisions in real-time is crucial for organizations across diverse industries. Whether you’re managing a smart city, monitoring environmental changes, overseeing logistics, or tracking sales performance, having access to up-to-the-minute data is a game-changer. That’s where ArcGIS Dashboards step in, offering a dynamic and visually compelling way to monitor, analyze, and act on real-time information.
Related: Five Tips to Improve Your ArcGIS Dashboards

The power of real-time visualization
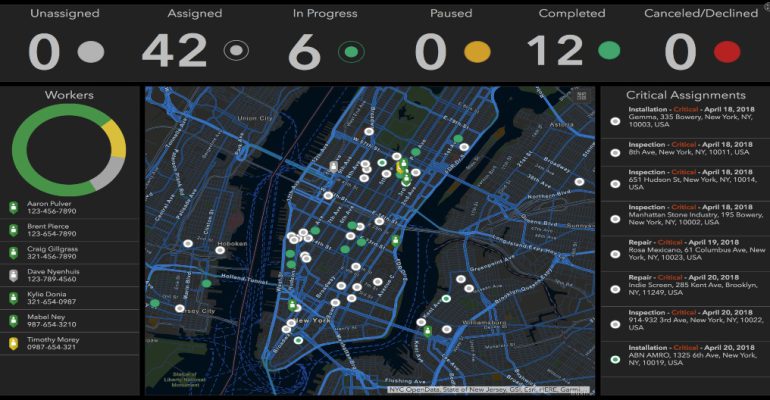
ArcGIS Dashboards are more than just data visualization tools; they are powerful decision support systems that transform complex data into actionable insights. These dashboards allow you to monitor live data streams, track key performance indicators, and visualize trends and patterns, all in real-time. Here’s why ArcGIS Dashboards are a game-changer for effective decision making:
Immediate insights
ArcGIS Dashboards provide immediate access to your data, enabling you to respond promptly to changing conditions. Whether it’s traffic congestion, weather events, or customer behavior, you can see what’s happening right now and make decisions accordingly.
Customizable layouts
Tailor your dashboard to your specific needs. With an intuitive drag-and-drop interface, you can create custom layouts that display the information most relevant to your goals. This flexibility ensures that your dashboard aligns perfectly with your decision-making processes.
Visual storytelling
Data can be overwhelming, but ArcGIS Dashboards transform it into visual stories. Use charts, graphs, maps, and images to convey complex information in an easily digestible format. This makes it easier for stakeholders to grasp critical insights at a glance.
Integration capabilities
ArcGIS Dashboards seamlessly integrate with other data sources, applications, and sensors. Whether it’s IoT devices, databases, or third-party software, you can bring all your data into one centralized platform for comprehensive analysis.
Collaboration
Decision making is rarely a solo endeavor. ArcGIS Dashboards enable collaboration by allowing you to share your real-time visualizations with team members and stakeholders, ensuring everyone is on the same page.
Industry applications
Let’s explore how ArcGIS Dashboards are revolutionizing decision making across various industries:
Smart cities
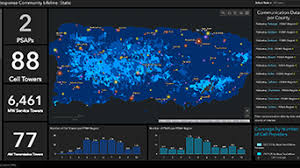
In the realm of urban planning, ArcGIS Dashboards help city officials monitor traffic flow, air quality, energy consumption, and emergency response in real-time. This data-driven approach allows cities to enhance citizen services and optimize resource allocation.
Related: Transforming Urban Planning with ArcGIS: A New Era of Smart Cities
Logistics and supply chain
For logistics companies, ArcGIS Dashboards provide insights into inventory levels, delivery routes, and transportation conditions. This real-time visibility enables efficient route planning, reduces delays, and enhances customer satisfaction.
Environmental monitoring
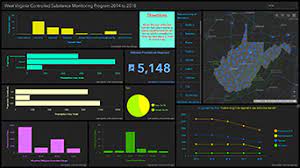
Environmental organizations use ArcGIS Dashboards to track climate data, water quality, and habitat changes. Rapid response to environmental threats becomes possible, aiding in conservation and disaster management.
Sales and marketing
In the business world, ArcGIS Dashboards assist in tracking sales performance, customer demographics, and market trends. Companies can make data-driven decisions on marketing strategies and product placements, leading to improved ROI.
The ability to make informed decisions in real-time is no longer a luxury but a necessity. ArcGIS Dashboards are your gateway to achieving just that. As organizations continue to embrace data-driven strategies, these dashboards will play a pivotal role in shaping a brighter and more efficient future across industries. Harness the power of real-time data visualization and take your decision-making processes to the next level with ArcGIS Dashboards.