How to Perform Multidimensional raster analysis in ArcGIS Pro
July 27, 2022 2022-07-27 7:16How to Perform Multidimensional raster analysis in ArcGIS Pro
Multidimensional data represents data captured at multiple times or multiple depths or heights and it includes the elements of time and pressure. It’s captured by satellite observations in which data is collected at certain time intervals or generated from numerical models in which data is aggregated, interpolated, or simulated from other data sources. Analysis of Multidimensional raster data in ArcGIS Pro is made possible with ArcGIS image analysts or spatial analysts.
Common storage formats of this data are netCDF, GRIB and HDF. Examples of multidimensional data can include Optical Imagery (NDVI, Land Cover analysis,), Ocean data (SST, currents), Weather data (Humidity, Temperature, wind) and Land (Soil Moisture, Precipitation).
The importance of multidimensional data includes finding anomalies, exploring trends, evaluating changes, predicting, and forecasting.
1. On the Map tab, in the Layer group, click the Add Data drop-down menu and select Multidimensional Raster Layer. This opens the Add Multidimensional Raster Layers dialog box.
Using this tool can import variables as individual layers.
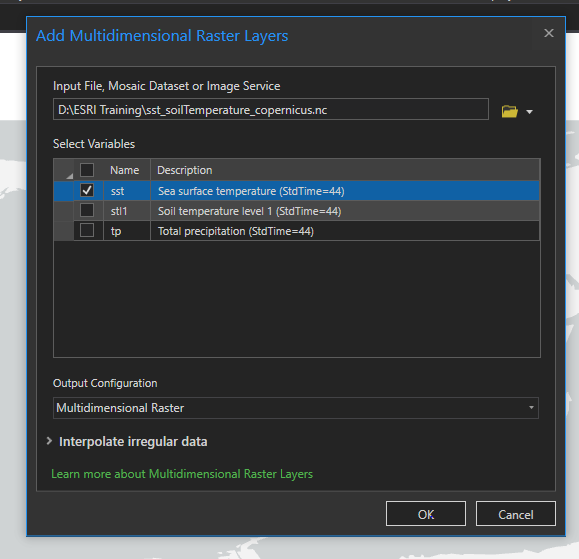
2.On the dialog box, click the Import Variables drop-down. Select the folder with the raster data.
3.On the Add Multidimensional Raster Layers dialog box, in the Select Variables table, select one or multiple variables.
4.Choose an Output Configuration option and, optionally, the interpolation method, and click OK.
To add multiple layers, in the Output Configuration choose Multidimensional Multivariate raster.
Geoprocessing tools.
- On the analysis tab, in the layer group click Geoprocessing tools. Image analyst tools>Multidimensional analysis>Aggregate multidimensional raster (Enables you to identify the maximum and minimum temperature of each location.)
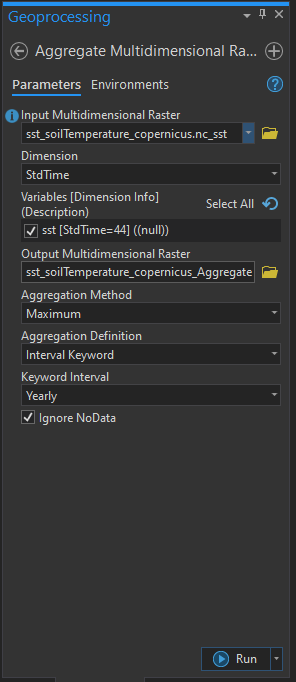
Click Run.
2. On the analysis tab, in the layer group click Geoprocessing tools.
Image analyst tools>Multidimensional analysis>Generate multidimensional anomaly (Enables one to see how much variation is in a data)
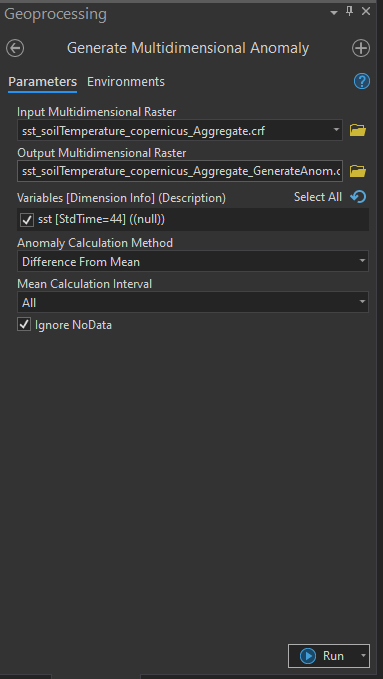
Click Run.
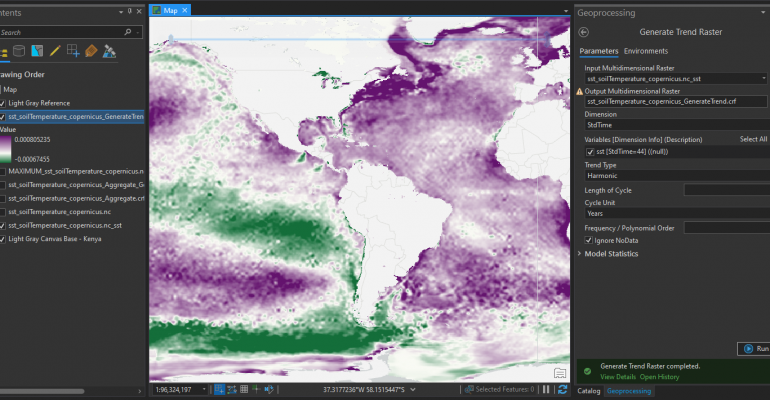
Trend and Prediction analysis
1.Multidimensional tab>analysis layer group click Trend.
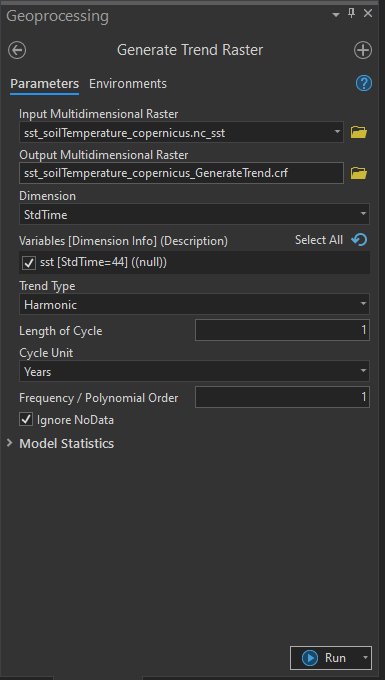
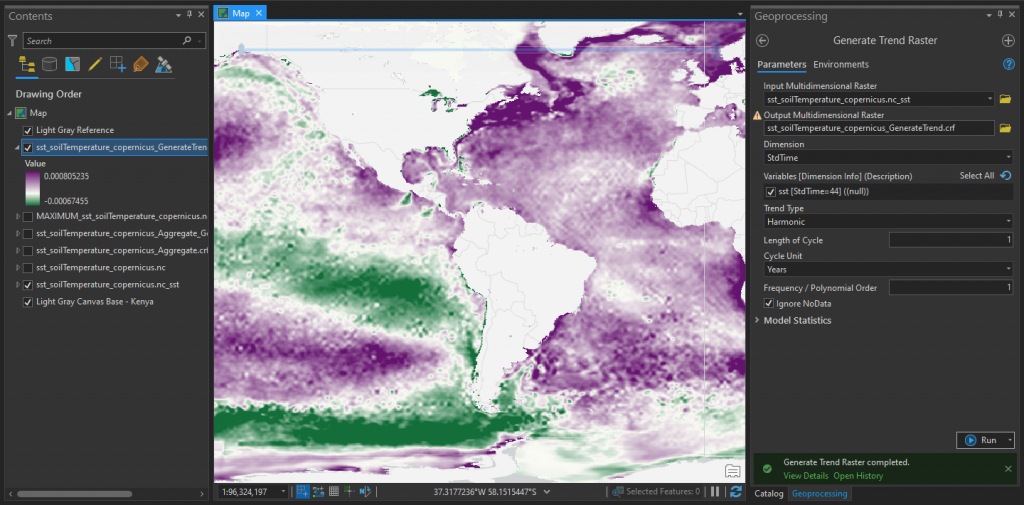
Click Run
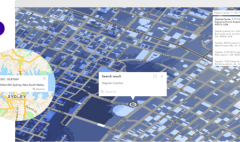
Results of the analysis.
Predict analysis.
- Multidimensional tab>Analysis layer group click Predict.
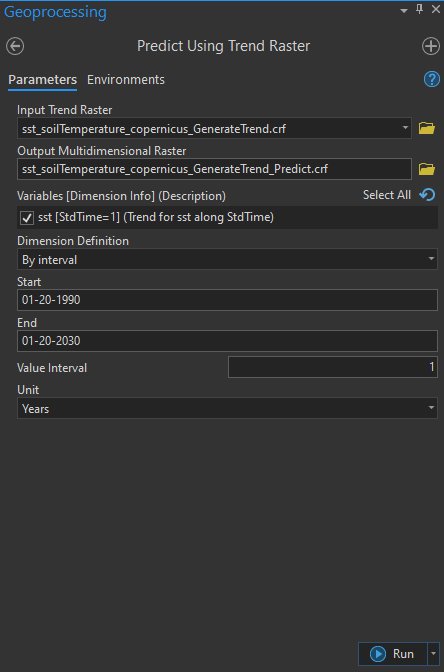
Click Run.
Results of the analysis.
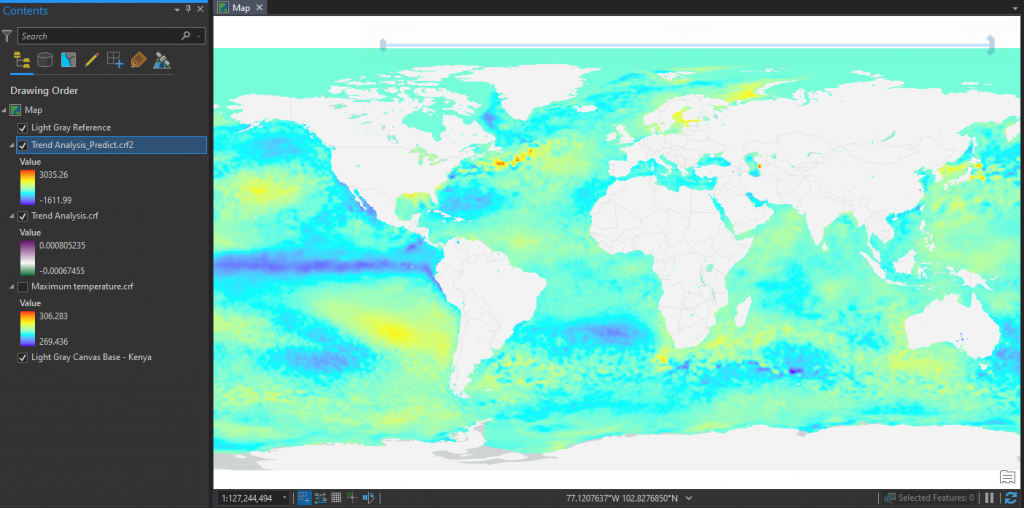
The results for this analysis can be used to predict places that would most likely be affected by El’ Nino.
Understanding how human and natural environments have changed in the past and predicting what will happen in the future is increasingly important for studying climate change, urban sprawl, deforestation, and more. To address these concerns, performing such analysis will show you how to use the ArcGIS framework to understand historical trends, see change, and predict future scenarios with a time-series collection of imagery.
To learn more about this and other ArcGIS platforms, click here to enroll for our training program.
By Angela Savayi – Products Engineer
Comment (1)
Xavier Ndikumana
Very important. Noted with thanks