
5 Tips to Jumpstart Your Spatial Analytics
September 14, 2026 2026-09-14 9:03
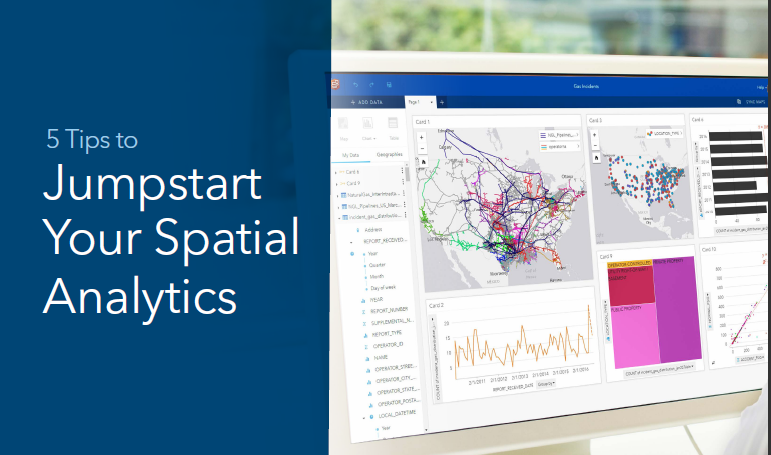
5 Tips to Jumpstart Your Spatial Analytics
Spatial data can reveal patterns, relationships, and opportunities that may otherwise remain hidden. For GIS professionals, analysts, and organizations working with location-based information, the challenge is often not having enough data, it’s knowing how to turn that data into useful insights quickly and communicate those insights effectively.
Modern spatial analytics brings together mapping, data analysis, visualization, and business intelligence capabilities to make this process more accessible and efficient. Here are five practical ways organizations can jumpstart their spatial analytics workflows.
1. Make Analysis Simpler with Drag-and-Drop Workflows
Spatial analysis does not always need to involve complicated workflows. Modern GIS tools can simplify the process by allowing users to work with data through intuitive, drag-and-drop interactions.
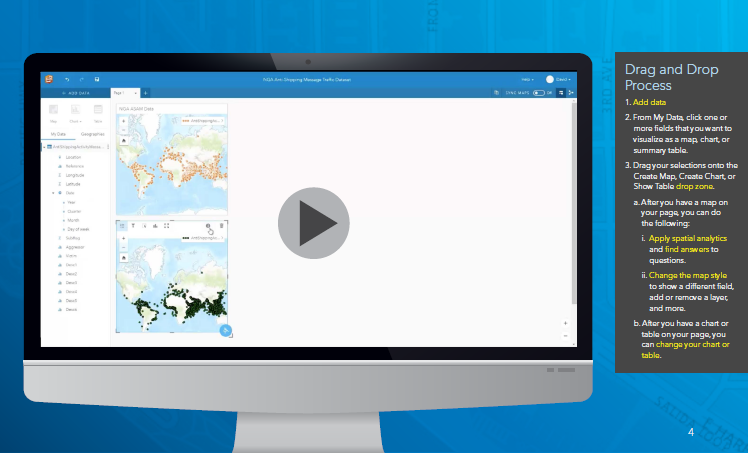
Instead of relying on a single map filled with multiple layers, analysts can view maps, charts, and tables alongside one another. This makes it easier to explore data from different perspectives and identify relationships that may not be immediately visible. Interactive visualizations also allow analysts to modify their analysis as they work, helping them move quickly from exploring a dataset to discovering meaningful patterns.
2. Bring Data from Different Sources Together
Data is often spread across departments, databases, spreadsheets, and GIS platforms. Working with these sources separately can make it difficult to develop a complete understanding of a problem. Spatial analytics can help bring these datasets together. Enterprise databases, Excel spreadsheets, ArcGIS data, geodatabases, and demographic information can be incorporated into an analysis.
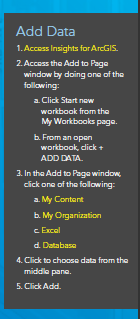
By combining spatial and nonspatial information, organizations can add valuable context to their data and create a more complete picture of what is happening.
3. Ask Better Questions of Your Data
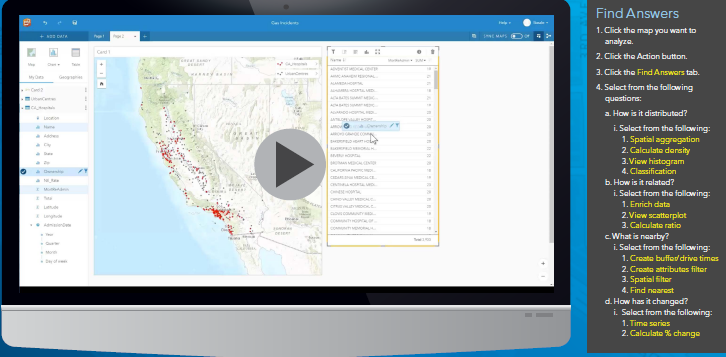
Effective spatial analysis starts with asking the right questions. Rather than simply asking where something is located, analysts can explore how things are distributed, how they are related, what is nearby, or how conditions have changed over time. Spatial analysis can uncover patterns that are difficult to identify in spreadsheets or raw datasets. Techniques such as spatial aggregation, density analysis, buffers, drive-time analysis, spatial filtering, and finding the nearest features can help turn complex datasets into actionable information.
The result is a more structured approach to solving spatial problems and developing evidence-based insights.
4. Combine Maps, Charts, and Tables
A map can show where something happens, but combining it with charts and tables can provide a much deeper understanding of why it happens. Modern spatial analytics allows users to visualize and analyze information through maps, summary tables, and different types of charts. Analysts can also apply attribute and spatial filters to focus on the information that matters most.

This combination of visualizations makes it easier to identify trends, compare values, and understand relationships across datasets. For organizations, this means decision-makers can move beyond simply viewing data to understanding what the data means.
5. Document and Share the Analytical Process
Good analysis is not only about the final result. It is also about being able to explain how that result was reached. Modern GIS workflows can record the data used, filters applied, and analytical steps taken. This creates a transparent workflow that can be shared with colleagues and stakeholders.
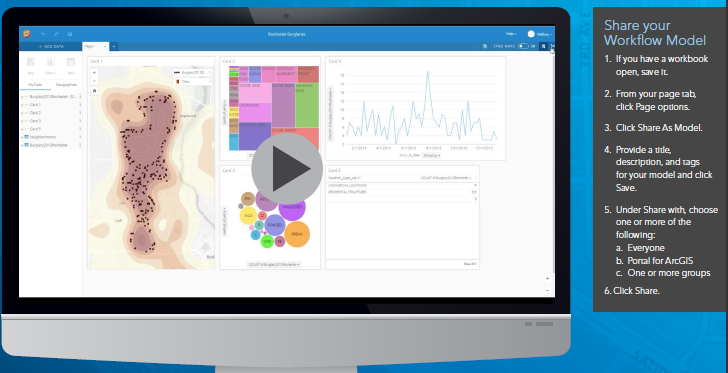
Sharing the process makes it easier for teams to understand, reproduce, and build on previous analyses. It can also help organizations communicate findings more effectively and support better decision-making.
Turning Spatial Data into Action
Spatial analytics can help organizations move from simply collecting data to discovering what that data can tell them. By simplifying analysis, connecting multiple data sources, asking better questions, combining visualizations, and sharing workflows, teams can make spatial information more useful.
The goal is not simply to create more maps. It is to uncover insights, communicate them clearly, and use them to support smarter decisions. As spatial analytics continues to evolve, these capabilities make it possible for more professionals to explore location-based information and turn it into meaningful business and operational value.
Ready to transform complex location data into actionable business intelligence? Explore these strategies in detail and see how intuitive spatial workflows can empower your entire team.
For this and more insights, subscribe to ArcHabari, our weekly newsletter!