Home
June 8, 2022 2025-02-26 11:24Home
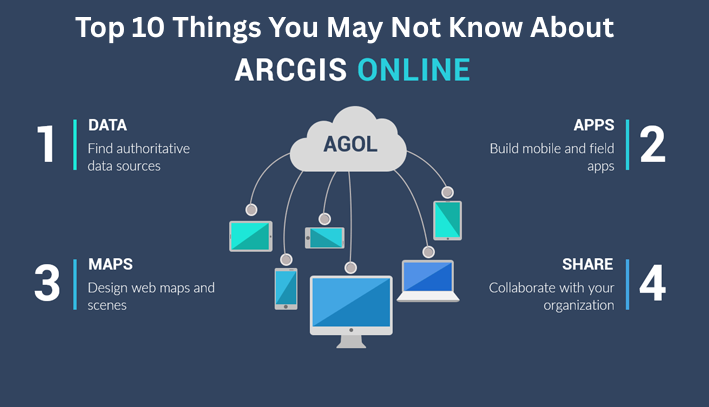
Top 10 Things You May Not Know About ArcGIS Online
 Rachael Mutuli
 January 12, 2026
Top 10 Things You May Not Know About ArcGIS Online
Read More
Prepare for the Next Generation of ArcGIS Survey123
Rachael Mutuli
January 8, 2026
For years, ArcGIS Survey123 has been a trusted tool for organizations that depend on smart forms and reliable field data…
Read More

From Curiosity to Impact
Rachael Mutuli
January 6, 2026
At Esri Eastern Africa, our internship program is designed to expose students and young professionals to real-world geospatial problem-solving.
Read More
How Being Involved in Esri YPN Gains You GISP Contribution Points
Rachael Mutuli
December 18, 2025
In the fast-evolving field of Geographic Information Systems (GIS), continuous professional development is essential for standing out in a competitive…
Read More

What’s New in ArcGIS Field Maps (25.3.0 Release)
Rachael Mutuli
December 15, 2025
On September 30, Esri delivered the 25.2.0 release of ArcGIS Field Maps, an off-cycle, mobile-only update that represented a major…
Read More

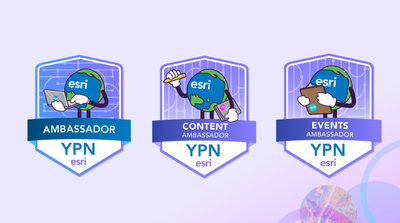
Rise Above the Competition: Join the YPN Ambassador Program
Rachael Mutuli
November 26, 2025
The Esri Young Professionals Network (YPN) Ambassador Program is your opportunity to actively engage in the GIS community and stand…
Read More
What’s New in ArcGIS Drone2Map 2025.2
Rachael Mutuli
November 24, 2025
The 2025.2 release of ArcGIS Drone2Map introduces a robust set of upgrades designed to streamline workflows, enhance 3D realism, and…
Read More

Tips to Future-Proof Your GIS Career
Rachael Mutuli
November 19, 2025
As GIS continues shifting toward web-based solutions, the skills you need to stay competitive are evolving too. You can future-proof…
Read More

Transforming Environmental Engineering with GIS
Rachael Mutuli
November 18, 2025
For Nixon Asiimwe, a final-year Environmental Engineering student at Kyambogo University in Kampala, Uganda, the world of geospatial technology opened…
Read More
ArcGIS Desktop Retirement: The Next Generation of Mapping is Here
Rachael Mutuli
November 12, 2025
Why ArcGIS Desktop is Retiring For decades, ArcGIS Desktop has been a trusted solution for GIS professionals worldwide. However, with…
Read More
Your Path to Entering the 2025 ArcGIS StoryMaps Competition
Rachael Mutuli
November 10, 2025
ArcGIS StoryMaps continues to be one of the most powerful and accessible platforms for sharing meaningful place-based stories.
Read More
3 Tips for Changing to a GIS Career
Rachael Mutuli
November 3, 2025
Geographic Information Systems (GIS) is a rapidly expanding field—valued at $8.1 billion in 2020 and projected to reach $17.5 billion…
Read More

Fusing Data, AI, and Maps: How Giovanni Bwayo is Pioneering the Future of GeoAI

When you meet Giovanni Bwayo, his quiet confidence and deep curiosity immediately stand out. A Data Scientist and Web Developer…
Read More