
What’s New in ArcGIS StoryMaps: August 2026 Updates
August 19, 2026 2026-08-24 7:24
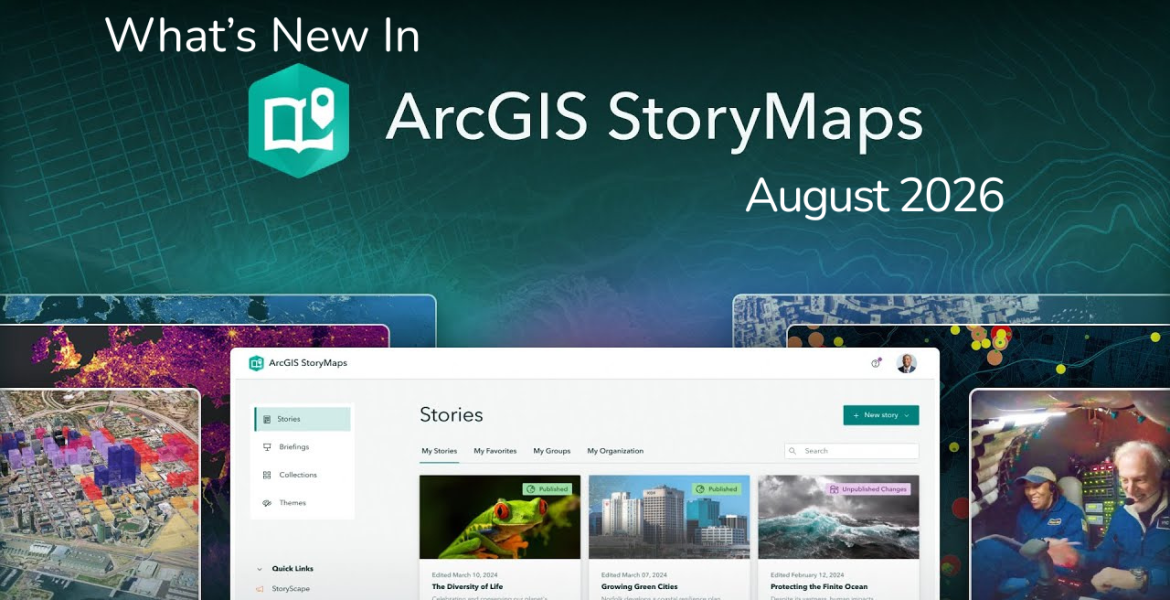
What’s New in ArcGIS StoryMaps: August 2026 Updates
Great geospatial stories do more than present information, they help audiences explore, understand, and connect with a place or issue. ArcGIS StoryMaps continues to evolve with new capabilities designed to make storytelling more interactive, accessible, and engaging. The August 2026 updates introduce new ways to involve your audience, transform existing content into visualizations, create more intuitive map interactions, and customize the look and feel of your stories.
Here are some of the highlights.
Make Your Stories More Interactive with Quizzes
StoryMaps now includes a Quiz block, giving authors a simple way to turn readers from passive viewers into active participants.
Quizzes can be useful for a range of applications, including:
- Training and educational content
- Public awareness campaigns
- Museum and cultural exhibits
- Community engagement
- Knowledge checks and reflection activities
You can create questions with up to four answer choices, identify the correct response, and provide hints or explanations. You can also customize the completion message and allow readers to retake a quiz.
For stories that aim to educate or encourage reflection, quizzes provide another way to keep audiences engaged with the narrative.

Turn Images of Charts and Tables into Editable Content
Have an old report containing a chart or table that you want to use in a StoryMap? You can now convert an image of a chart or table into a chart or table block. After adding the image to your story, select Convert and choose either Convert to chart or Convert to table. Once the conversion is complete, review the data and settings to make sure everything has been interpreted correctly.
This can save time when repurposing existing reports and documents while making information more accessible and dynamic.
Create More Direct Connections Between Text and Maps
Map actions are becoming even more powerful. With the latest update, authors can configure narrative text to open a map pop-up. This means readers can select text within your story and immediately access additional information about a specific feature.
This creates a stronger connection between your written narrative and geographic information, allowing you to guide readers directly to the details that matter.
Map Actions Come to Briefings and Frames
Map actions are also now available in briefings and frames. Authors can combine a map and text on a slide and use text-based actions to direct readers toward specific locations, patterns, or information within the map.
This provides another way to build interactive presentations and communicate spatial information without overwhelming your audience.
Create More Flexible Data Visualizations with Pictographs
Pictographs, introduced earlier this year, provide a visual way to communicate numbers and proportions using recognizable symbols. The latest enhancements give you more control over their appearance. You can now:
- Choose between Single value and Part to whole
- Automatically arrange icons or customize the number displayed per row
- Place up to three pictographs alongside one another
These options make it easier to create visualizations that communicate key statistics at a glance.
More Control Over ArcGIS StoryMaps Collections
Collections provide a way to bring multiple pieces of content together into a single navigable experience. Following the introduction of maps and scenes in collections, the August update gives authors more editing options directly within a collection.
For maps, you can adjust:
- Layers
- Bookmarks
- Map options
For images, you can use editing tools such as:
- Crop
- Markup
- Rotate
- Fit or Fill
- Background color or blur
- Alternative text
- Attribution
This makes it easier to refine your collection without having to leave the collection-building experience.
Preview Themes Across Different StoryMaps Experiences
Themes help establish a consistent visual identity across ArcGIS StoryMaps content. The Theme Builder now allows you to preview how your theme will look across different content types, including stories, collections, briefings, and frames.
This is particularly useful for organizations that want to maintain consistent branding across multiple storytelling products.
Customize Briefing Slide Backgrounds
Theme Builder also now includes options for customizing briefing slide backgrounds.
You can choose a:
- Color
- Gradient
- Image
This allows organizations and individuals to create a more consistent visual style across their briefings.
Other Updates to Explore
There are several additional improvements included in the August release:
- The ArcGIS StoryMaps assistant can now use your preferred language when generating alternative text and story insight summaries.
- Briefing slide numbers are now visible in print preview.
- Suggested alternative text is now available for express maps.
- A High Contrast Dark option has been added to featured themes.
Together, these smaller enhancements contribute to a more accessible and flexible storytelling experience.
Tell More Engaging Stories with ArcGIS StoryMaps
The latest updates give ArcGIS StoryMaps authors more ways to create experiences that encourage audiences to explore, interact, and learn. Whether you’re developing a conservation story, presenting research findings, communicating development projects, creating educational content, or sharing insights with decision-makers, these new capabilities can help you make your geographic information more engaging.
If you’re already using ArcGIS StoryMaps, now is a great time to explore these new features and consider how they can improve your next story.
Read the full August 2026 update: What’s New in ArcGIS StoryMaps (August 2026)
Build a Story with Esri’s ArcGIS Storytelling Team
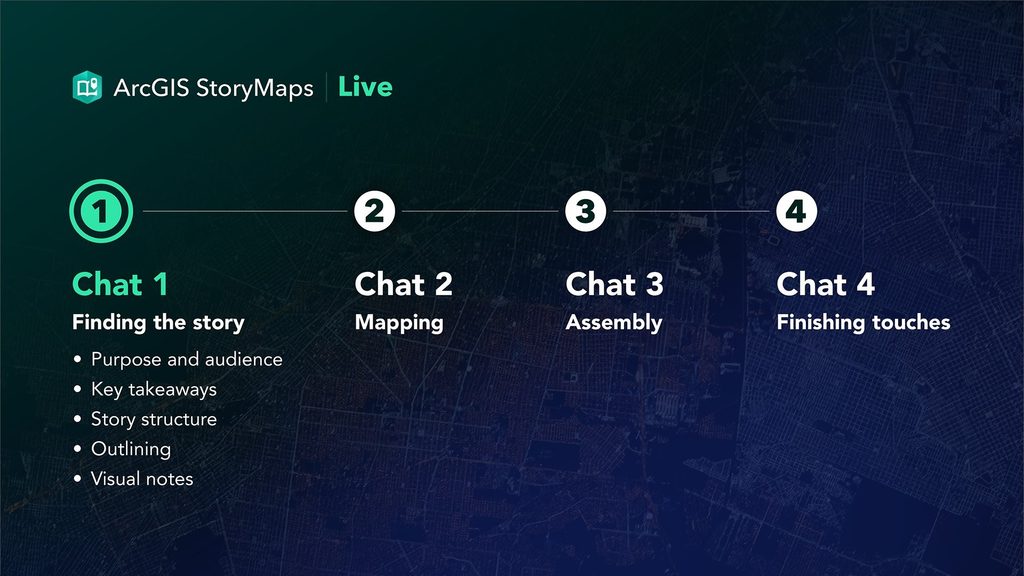
Want to strengthen your storytelling skills? Join the 2026 ArcGIS StoryMaps Live chat series, where the ArcGIS Storytelling team shares practical techniques and workflows for creating compelling geospatial stories.
Watch & learn: https://hubs.li/Q04tGlvp0
Read more: https://hubs.li/Q04tGzjk0
You can also explore the 2026 ArcGIS StoryMaps Competition, which opens on 8 September 2026, and discover how your maps can help communicate ideas, challenge assumptions, and inspire positive change.